Comparion Dashboard is an information management tool where you can add different Comparion pages and widgets to the Dashboard as panels.
A model without any dashboard is displayed as below:

Here we see three options:
(1) Create New dashboard - add an empty dashboard or with a predefined layout.
(2) Create from Sample - add from sample dashboard.
(3) Upload Dashboard - upload a dashboard file. You can upload *.json, *.txt, *.dash, *.rep file with maximum 30MB size.
The same options are also available from the + Create button at the top left:

Create New Dashboard
Click  or from Create > Create New Dashboard.
A dialog box will open as shown below where you will enter the dashboard name, an optional note (or description), and the layout.

The first layout above is a blank layout (no placeholder). The rest of the layouts have pre-existing placeholders with specific sizes, row x column (e.g 3x6, 3x3, etc.). These placeholders are the container of the panels.
After specifying the dashboard properties, click Add.
Note: You don't need to worry about the layout or panel sizes at this point since you can still modify this after specifying the dashboard properties.
The added dashboard will be listed in the dashboard drop-down and new options will appear in the toolbar.

When selecting the blank layout, the added dashboard will show the "Place new panel" button as shown below: 
Other dashboard layouts with predefined sizes will show placeholders (boxes with plus icon) as in the example below:

The dashboard name is shown as a header in blue font, and the description is displayed below it.
Clicking on the dashboard name will open the "Edit Dashboard Properties" dialog box where you can edit the dashboard name or note. You can also open the same dialog box by clicking the pencil  icon from the toolbar:

Unchecking "Show panel borders" will hide the panel borders and the dashboard will have a gray background.
You can create another dashboard from the  button.
If you have more than one dashboard, you can switch to another dashboard by selecting from the dashboard drop-down.
Click the clone icon  to create a copy of the dashboard.
Click  to delete the dashboard.
You can also add a new dashboard from any Comparion page that can be added to the dashboard. This will be discussed in the Create Panel from page section below.
Add Panel from Dashboard
Panels are pages or widgets being added to the dashboard.
You can create a new panel in the Dashboard page in different ways:
(a) Click the  button (displayed only when the dashboard is empty)
(b) Click the  button on the toolbar at the top
(c) Click the plus icon in the placeholder
Clicking any of the new panel options mentioned above will open the new panel dialog box:

- Panel Type - to select the Comparion page or widget that you want to add to the dashboard.
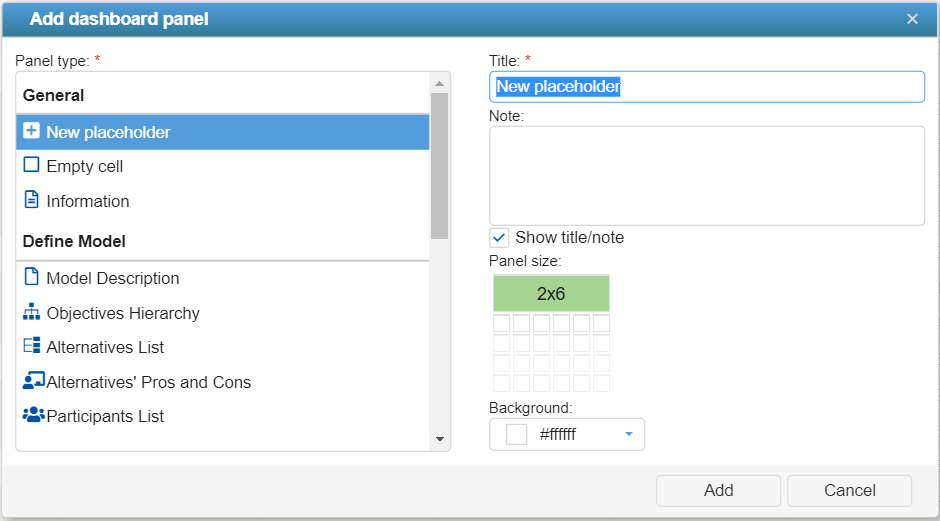 General panels:
 General panels:
- The "New placeholder" is selected by default; this is an empty panel that displays a placeholder with a plus icon where you can select a page or widget afterward.
- Empty cell - a blank panel you can use to add spaces between the panels; for example, you may want to place the next panel in the next "row."
- Information - add rich text information.
Define Model pages/widgets:
- Model Description
- Objectives Hierarchy
- Alternatives List
- Alternatives Pros and Cons
- Participant List
Overall Results pages/widgets:
- Charts (Alternatives and Objectives Charts)
- Grids (Alternatives and Objectives Grids; Portfolio View)
- Sensitivities (Dynamic, Performance, Gradient, 2D, Head to Head, Sensitivities Delta Alternatives)
Allocate:
- Portfolio View
2. Title and Note -- panel title and the panel description (optional) 
You can show or hide the title of note in the dashboard by checking or unchecking the Show title/note checkbox.
3. Panel size - is the size of the panel: row x column. You can change the size by clicking on the boxes. 
4. Color - define the background color of the panel by selecting from the color picker; this is white by default. 
After defining the panel details, click the Add button. This will display the added panel into the dashboard:

Hovering on the "i" icon to the left of the panel name will display the panel note that was specified.
Add Panel from Page
You can also add a panel to a new or existing dashboard from Comparion pages or widgets mentioned above:

In the example above, we added the Objectives hierarchy to a new dashboard.
This was done by clicking the "Add page to dashboard" option at the top right of the Objectives page.
This will open a dialog box where you will enter the Panel name and then select to add the panel to an existing dashboard in the model, or create a new one. In our example, we've added the panel to a new dashboard (Dashboard 2 new).
After adding a new panel, a prompt will appear asking to open the recently created panel. Clicking Yes will redirect you to the dashboard page.
Manage Panels (Edit, Clone, Delete, Open original page, etc.)
Double-clicking the panel name will open the Edit Panel Properties dialog box.
Hovering on the panel will display the Gear and maximize
  icons.
Clicking on the Gear icon (or right-click the panel name) will display five icons as shown below:
- Edit Panel Properties
 - open the edit panel dialog box where you can specify the panel title, note, size, and color. You can also double-click the panel name to open the same dialog box. You can also open the same dialog box when double-clicking on the panel name.
 - Clone Panel
 - create a copy of the panel.
 - Delete Panel
 - delete the panel.
 - Open original page
 - open the source page of the panel. For example, for the Alternatives List panel, clicking this icon will open the DEFINE MODEL > Alternatives page.
 - Panel JSON data
 - open the panel JSON data.
 - open the edit panel dialog box where you can specify the panel title, note, size, and color. You can also double-click the panel name to open the same dialog box. You can also open the same dialog box when double-clicking on the panel name.
  - open the source page of the panel. For example, for the Alternatives List panel, clicking this icon will open the DEFINE MODEL > Alternatives page.
  - open the panel JSON data.
 The maximize icon will open a maximized view of the selected panel.
Open Panels List
The Panels List can be opened as a drop-down or a floating list:
(1) Drop-down Panels List - clicking the drop-down  arrow will open the panels list drop-down. Clicking on a panel name will jump to that panel and flash it for 2 seconds as shown below:

(2) Floating Panels List - you can also open a floating panels list by clicking the  button.

You can also click a panel name from the list above to jump to that panel the same way as with the drop-down panels list.
Hovering on a panel name will show the Edit and Delete Panel button.

You can also rearrange the panels by dragging and dropping the  icon to the right of the panel names:

Resize Panel
In addition to resizing a panel from "Edit Panel Properties," you can also simply drag the panel border as shown below:

Move or Re-arrange Panel Position
You can move or switch the position of the panels by dragging a panel and dropping it to the desired position as shown below: 
Alternatively, you can also rearrange the panels from the "Floating Panels list" by dragging and dropping theicon to the right of the panel name as explained here.
Panel Regular or Flow View
The Regular View displays the panel based on the panel size specified, while the Flow View will have only one panel for each row -- one panel to fit the browser's page width.

Data Settings (for Results Panels)
When the dashboard has results panels (Grids, Charts, and Sensitivities), the Data Settings will be available on the toolbar:

Options include the following:
- With respect to - select to display the results with respect to a given objective node
- Decimals - number of decimals to display
- Normalization - select Unnormalized, Normalized, or percentage Maximum
Additional options will be displayed in case there is any Sensitivity Analysis panel:
- SA User (applicable only for Sensitivity Analysis) - clicking this button will open a model where you can select the user or group that you want to display results for in the sensitivity analysis.
- Reset SA (applicable only for Sensitivity Analysis) - reset the sensitivities in case the results are temporarily changed by dragging the objective bars or alternative plots.
Note: More panel-specific options can be available on the panel toolbar that is accessible when clicking the Gear icon on each panel.
