June 12, 2020 | Version 6.0.15.39790
We are excited to announce the Comparion Dashboard Release.
- Dashboard
- Other Enhancements:
- Page Lookup
- Combined Reports Generator
- Responsive or Non-Responsive AnyTime Evaluation
- Question Text to Speech
- TeamTime Brainstorming Enhancements
- Multi-categorical Alternatives Attributes
- Participants Groups
- Export Efficient Frontier Grid
- Show Evaluation Progress on Participants screen
- Four at a Time Sensitivity: Objectives Pagination
- Charts Enhancements
- Alternatives Colors from Define Model
- Download and Get Links shortcuts
Dashboard
Comparion Dashboard is a powerful tool where you can add different Comparion pages or widgets to a dashboard as panels.
The pages/widgets you can add are the following:
- Model Description
- Alternatives list
- Objectives Hierarchy
- Alternatives Pros and Cons
- Participants List
- Grids (Alternatives, Objectives, Portfolio View)
- Charts (Alternatives, Objectives)
- Sensitivities
- Dynamic, Performance, Gradient, 2D, Head-to-head, Alternatives Performance
Panels can be moved around, maximized, resized, and more. You can create one or more dashboards as you need.

Combined Report Generator
Be able to generate a report in .xlsx format which comprises the following model data:
- Model Overview (Model Description)
- Alternatives and Objectives Priorities
- Information Documents
- Contributions Matrix
- Participants List
- Measurement Methods
- Inconsistency
- Consensus
- Resource Aligners Data (Scenarios, Dependencies, Constraints, Groups, Funding Pools, Time Periods, etc.)
This can be found on Reports page < Combined Report Generator.

Page Lookup
The Page Lookup allows you to open the list of Comparion pages. You can search and jump to a specific page at ease.
Responsive or Non-Responsive AnyTime Evaluation
AnyTime Evaluation pages can now be Responsive or Non-responsive.
In general, Responsive pages adapt content to fit different screen sizes, such as smartphones and tablets. On the other hand, Non-responsive pages have some features not yet available on Responsive Evaluation. See more details here.
The Project Manager can invite the participants to either Responsive or Non-Responsive Evaluation by checking/unchecking the "Use Responsive UI Links." 
Responsive Page:
Desktop

Mobile

Non-Responsive Page:

Question Text-to-speech
We've added a text-to-speech option on the Non-responsive evaluation.
Text to speech can be disabled, auto-played, or played on demand. This can be set-up on DEFINE MODEL > Define Particpants & Roles > Participants Display Options:

See example below:
Enhanced Resource Aligner's Infeasibility Analysis
Optimization can be infeasible when it may not be possible to satisfy all of the constraints specified. Expert Choice will, of course, report that there is no feasible solution when this condition arises.
With the Infeasibility Analysis, the Optimizer will analyze the constraints and suggest a possible combination of changes that can result in a feasible solution. In this enhanced version, you can now select whether to suggest only one (the best solution) or multiple possible solutions.

You can view the removed constraint(s) on each of the suggested solutions:


You can then modify the existing scenario based on the suggested changes or create a new scenario, as desired.

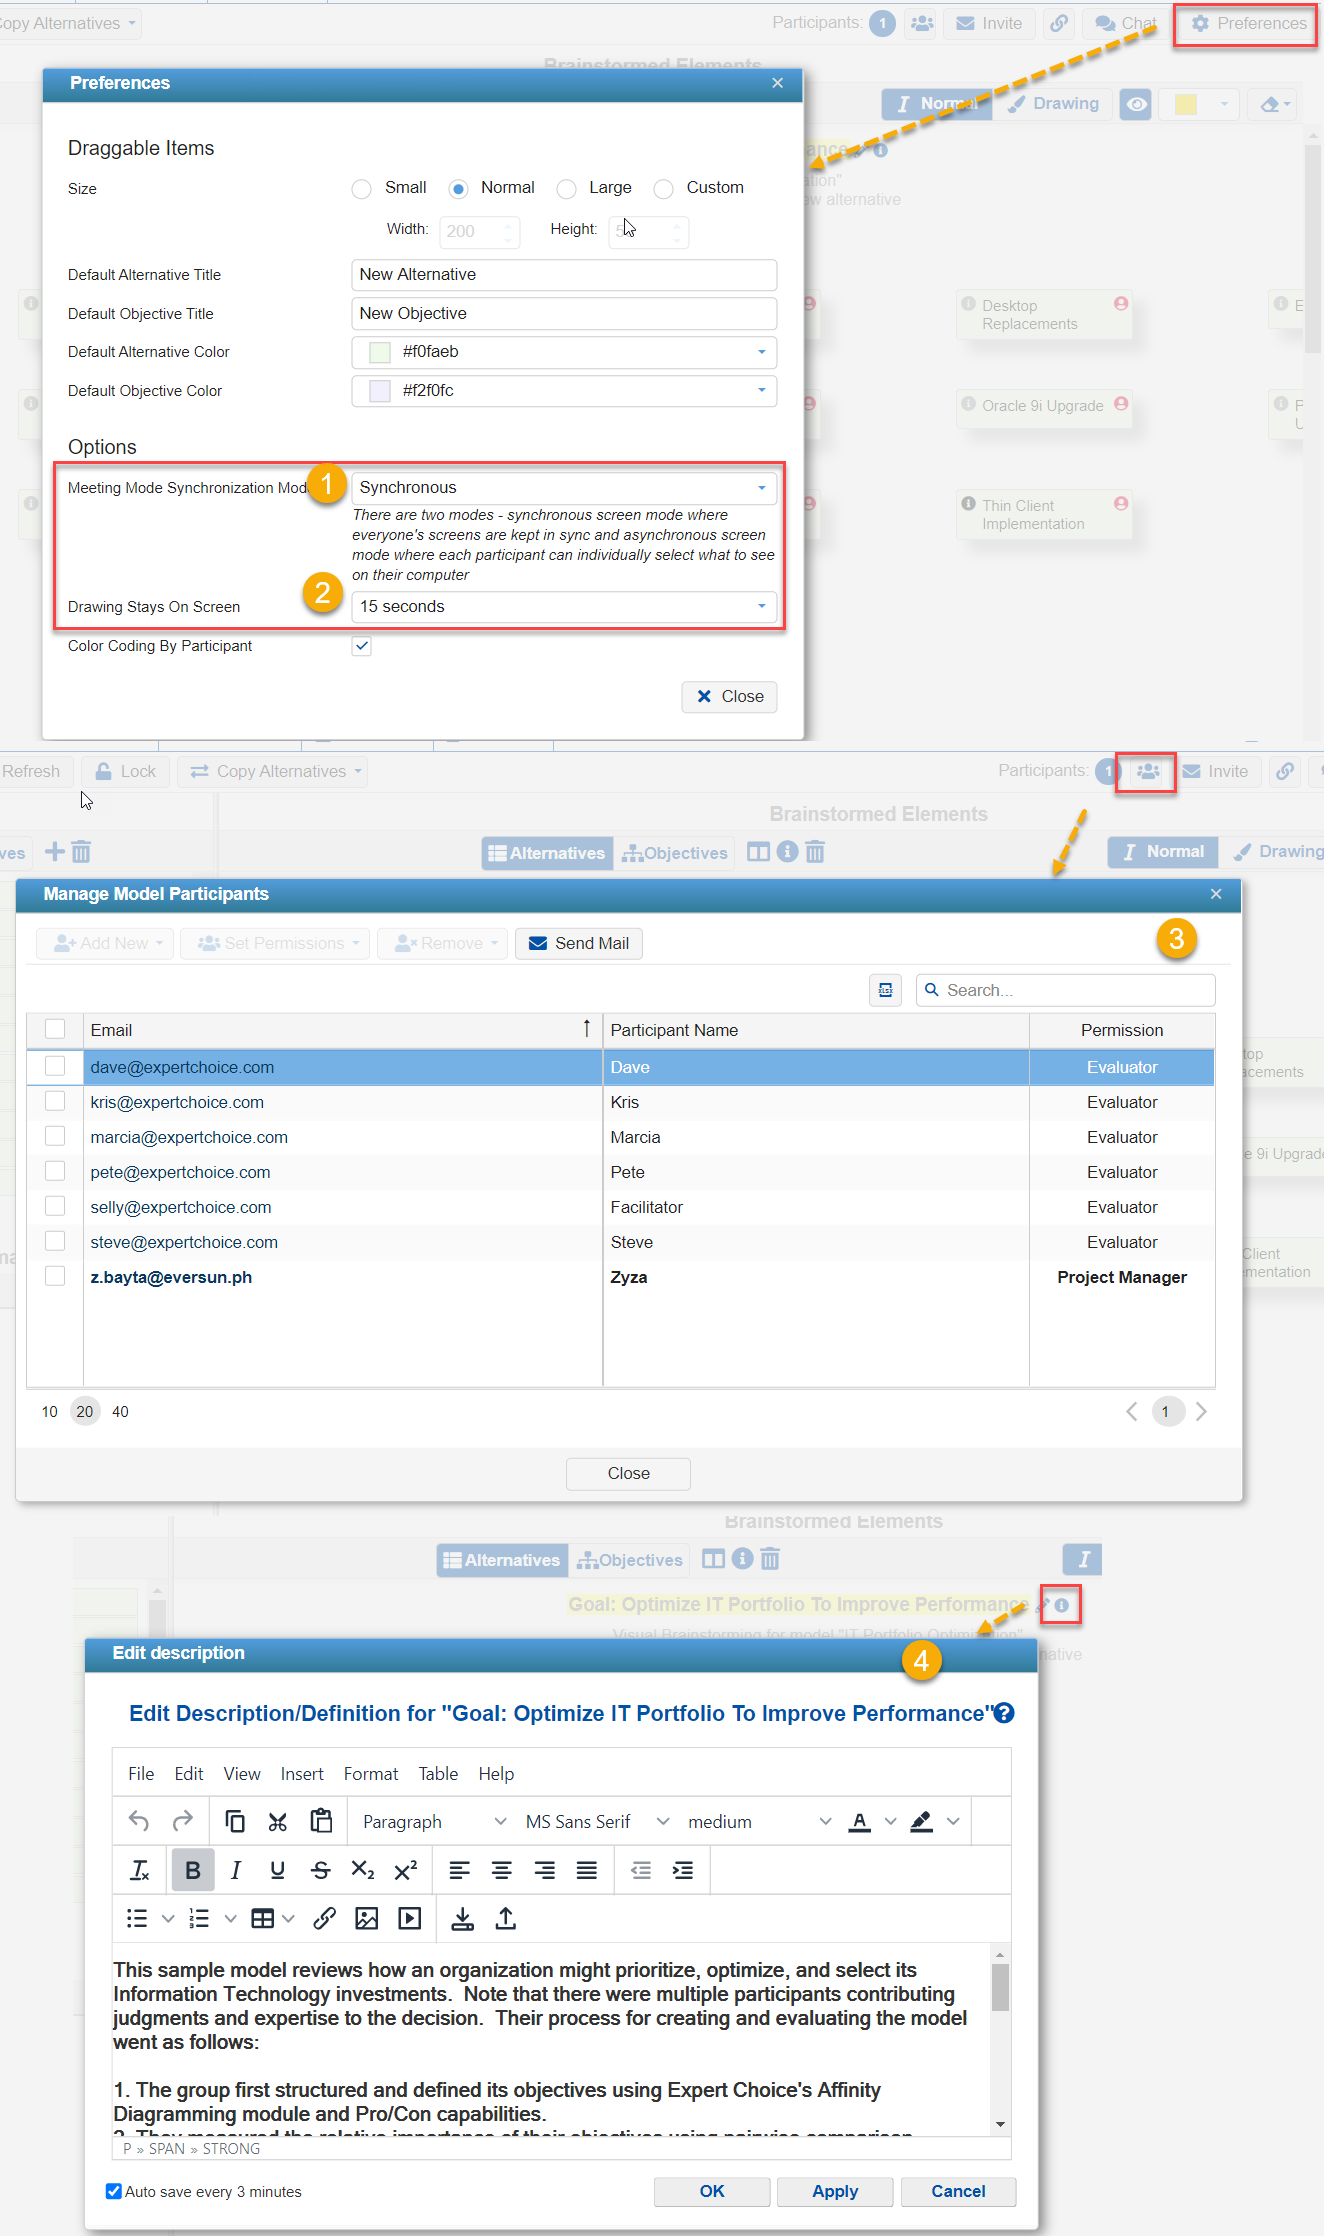
TeamTime Brainstorming Enhancements
We've done multiple enhancements for Comparion's TeamTime Brainstorming:
- Added Synchronous / Asynchronous options - on the previous version, the Teamtime brainstorming is only Synchronous, meaning the active tab both for the Model Elements and the Whiteboard are controlled by the Project Manager and it will be reflected on the meeting attendees' pages. The Asynchronous mode allows the meeting attendees to control the tab that they will access during the meeting.
- Option to auto-clear drawing by 15 seconds
- Ability to manage model's existing participants during the meeting (Add, Remove, Set Permission, Delete, Send Mail)
- Be able to add/edit the Goal node description
- Other UI enhancements...

Multi-categorical Alternatives Attributes
The multi-categorical attribute is a new type of alternative attribute which allows the Project Manager to assign multiple categories to the alternatives. Previously, we could only assign one attribute for each alternative.

Note: Multi-categorical attributes is not yet supported on datagrid, so it is "read only" on the exported .xlsx file.
Participants Groups
Added a separate page where you can manage the Participants Groups.

Export Efficient Frontier Grid
In addition to exporting the Efficient Frontier grid, we've added export options for the chart:

Show Evaluation Progress on Participants screen
Added a column to show the Evaluation Progress in the Participants page.

Four At a Time Sensitivity: Objectives Pagination
Added an option to select the number of objectives per page. This is helpful when there are many objectives in the model to make the sensitivity less busy.

Charts Enhancements
- Added options to show the Local and Global Objectives priorities on the Hierarchy tree
- Added connecting lines on the hierarchy tree to make the objectives leveling more obvious
- Ability to Sort the Hierarchy Tree

4. Added clockwise and counter-clockwise rotate; zoom in and zoom out options on Hierarchical Pie Chart

Alternatives Colors from Define Model
Be able to define the Alternatives colors in the DEFINE MODEL workflow, in addition to the Synthesize pages.
Download and Get Links Shortcuts
We've added the download and get link icons available at the right of the model name.
The download icon will open a dialog box asking whether to include the snapshot's data.
The get link icon will open a dialog box where you can copy the model link, anytime and Teamtime links, and brainstorming link.

