June 01, 2024 | Version 6.18.1
Summary of Changes: In this release, we are excited to introduce you to the following new functionalities:
- Color Settings
- Abstain Judgments
- Model Wording
- Resource Aligner Portfolio Canvas
- Contributions Grid Display
- Time Period Dependencies
- Dashboard New Panels
- Pairwise Verbal Scale Ratio
- Pairwise No. of Diagonal setting in the evaluation
- Collaborative Brainstorming Whiteboard Access
- Information Documents Enhancements
- Disabled Alternatives Enhancements
- Model Linkage
- Collect input Settings combined into one page
- Evaluation Judgment Count
Other minor enhancements include:
- Show the %Effectiveness on the Time Period Results screen
- Pagination when adding alternatives
- Reset Zoom on the Hierarchical Pie Chart
- Minor Dashboard Enhancements
- Simplified Measurement Methods screen
- Grid, Charts, and Sensitivities Enhancements
- Changes on the Inconsistency Improvement screen
- Font Size in Sensitivities
- Quick Help Enhancements
- Custom Column in TeamTime Meeting
- Select Participant on View Only Mode Evaluation
- Gradient Sensitivity Legend Lines
- Edit Model Name
- Radar Sensitivity Enhancements
- Open Model Lookup in another window
- "Forgot password" on the Signup/Login page
- Re-arrange columns on the Alternatives/Objectives Grid
- Model Name and Description in Collaborative Brainstorming Meeting
- Model Details Summary
- Tooltips to spell out labels on RA Columns
Color Settings
We now have flexible ways to assign colors to the Alternatives and Objectives:
- Custom Color - color is assigned to alternative and objective individually. (Note: This is also available on the previous version but only on limited screens - Alternatives Grid and some Sensitivities)
- Color Palettes - a new option where the Project Manager can select from predefined sets of colors for all the alternatives and objectives.


The Custom Color and Color Palette settings are available on the Synthesize screens (Charts, Grid, Sensitivities).
Abstain Judgments
Allows the evaluator to enter an "Abstain Judgment" instead of just skipping the evaluation. Abstain judgment can be enabled from the Set Measurement Options > Evaluation Settings:

Abstain judgment is applicable to all measure methods as radio button selection for rating, or as a toggle (non-rating).
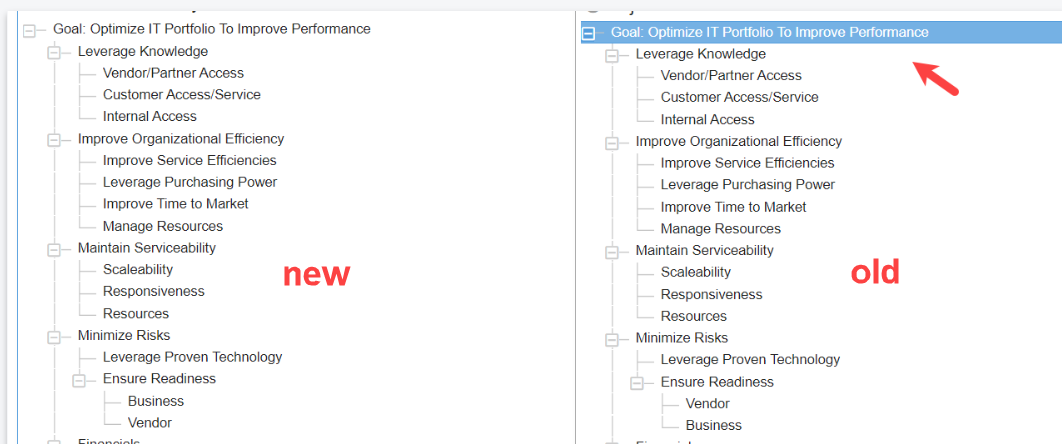
Model Wording
We added singular and plural terminologies for Objectives and Alternatives as a model setting. Previously, the model wording was defined from the Judgments options page and had only a "plural" form.
This can be done on the Define Model > Description/Details page:

You can also change the wording from the left navigation menu and landing page (right-click):
Portfolio Canvas
We improved the Resource Aligner Portfolio View which is now named Portfolio Canvas. The new Portfolio Canvas is more optimized for larger models and has additional improvements, such as freezing the column heading and the alternatives column for better viewing.

The New Portfolio Canvas panel in the Dashboard was also improved. You can now update the Allocation Settings (Ignore options, Scenario, Solve options, etc.) on the panel.

You can also toggle the Benefit column to Cost of Delay (CoD), and show the corresponding ratio.
If Benefit is selected, we display the Cost and Benefit-cost ratio columns, and if CoD is selected we rename the corresponding columns to Duration and WSJF (Weighted Shortest Job First). 
Contributions Grid Display
Comparion now has two views for the Contributions settings: by Alternatives and by Objectives.

Time Period Dependencies
The Dependencies screen has been improved and additional dependencies were added for Time Periods.

Dashboard New Panels
Additional panels: Contributions, Information Documents, Participant Roles, Evaluation Progress, and Datagrid are now available in the Dashboard!

Pairwise Verbal Scale Ratio
The Project Manager can now display the verbal ratio (x3, x5, x7, x9) for single and multi-pairwise evaluation.

This option can be turned on from the Set Measurement Options > Participant display options:

Pairwise No. of Diagonal setting in the evaluation
The Project Manager can now update the no. of diagonals (All diagonals, 2 diagonals, 1 diagonal) for multi-pairwise graphical and verbal from the evaluation screen.
Changes made by the Project Manager will be saved on the model and applied to the evaluators.

Collaborative Brainstorming Whiteboard Access
Comparion now allows existing users of a model to access the Collaborative Brainstorming Whiteboard even if the meeting has not been started by the Project Manager.
This can be enabled by the Project Manager in the Define Model > Model Details page:

The users will be able to open the CS whiteboard from the Models list as shown below (not by using the CS link):

Note: The model must be online for whiteboard access to be allowed.
Information Documents Enhancements
Information Documents are now viewable from the Synthesize screens (Charts and Sensitivities).
Information documents can be opened as a new pop-out window:

(Note: The Project Manager can add new information documents, but if the alternative or the objective already has existing infodocs, you will need to edit this page at Define Model > Alternatives / Objectives, Information Documents or Evaluation pages).
Information documents can also displayed as tooltips (plain text).

We have also added the same pop-out window to open information documents from the Objectives and Alternatives page.


Disabled Alternatives Fixes and Enhancements
Disabled Alternatives are now excluded from the evaluation and will no longer show up on the results screens.


Disabled alternatives are not editable on the Information Documents and Participant Roles screens. In the Contributions screen, an option is added to show/hide the disabled alternatives.

Model Linkage
Display the list of linked or associated models:
- Save As (Copied from)
- Default Option Set Used
- Associated Risk Model

Collect input Settings
All the Collect input settings are now available on a single page:

Evaluation Judgment Count
We added the judgment count per page for multi-evaluations, this helps the evaluators to see if there are any missed judgments.
The overall judgment count is also updated as the evaluator enters/deletes judgment (on the previous version, the page needs to be reloaded first before the count will get updated).

Show the %Effectiveness on the Time Period Results screen
Show the calculated %Effectiveness on the Time period results page:

Pagination when adding Alternatives
We added pagination when adding alternatives, this is helpful when pasting many items that can cause the application to hang up.

Reset Zoom on the Hierarchical Pie chart
Added an option to reset the zoom ratio for the Hierarchical pie chart.

Minor Dashboard Enhancements
- Allow column resizing on the Alternatives and Objectives Grid
- Disable the row selection (blue highlight) on the Objectives and Alternatives Grid


Simplified the Measurement Methods screen
We removed the All tab on the measurement method screen:

Grid, Charts, and Sensitivities Enhancements
- The Grid alternative bars are now optional and the colors are based on the color settings

- Added labels on Charts dropdowns
- Improved the heading and labels (increased font size and spacing)

- Moved the Components button to the left
Inconsistency Improvement screen updates
- Renamed "Rank" to "Rank by Inconsistency"
- Added tooltip for Best Fit and Rank by Inconsistency
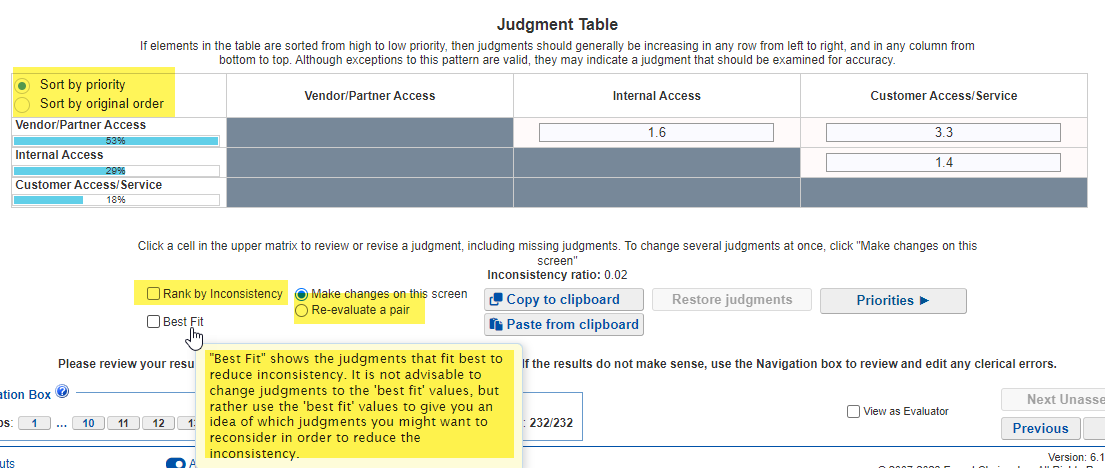
- Improved the sorting (use radio button)
- Renamed "Review all judgments in cluster" to "Re-evaluate a pair"
- Renamed "Click here if you think the inconsistency is too high" to "Click here to investigate comparison matrix and inconsistencies"
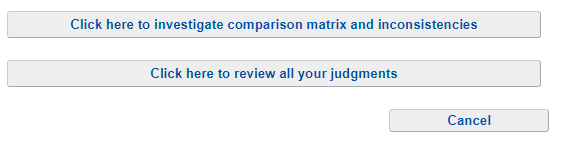
- Removed "Click here if you would like to redo judgments for one pair of elements" since it is just redundant to the Re-evaluate pair option on the Judgments Matrix


Font Size in Sensitivities
Added a font size dropdown on all the Sensitivity screens (Dyamic, Performance, Gradient, 2D, H2H, and Sensitivity Alternatives)

Quick Help Enhancements
Quick Help is a custom help that can be set up by the Project Manager which will be displayed during the evaluation process. The following enhancements are added:
- Text-to-speech on the Quick Help pop-out
- Changed the pop-out heading to orange
- Made the pop-out window wider

Custom Column in TeamTime Meeting
We applied the Custom Column functionality to the TeamTime meeting (previously only on AnyTime evaluation). The custom column allows the Project Manager to select another user or group to display on the results step instead of the default "Combined" results.

This is set up from Set Measurement Options > Participant display options:

Select Participants in View Only Evaluation
We added a participant selection dropdown on the View-only evaluation, this way the Project Manager can easily review different participant's evaluations without going back to the Evaluation Progress screen to select another user.

Gradient Sensitivity Legend Lines
We made an improvement that when the alternatives at the right are sorted by priority, the alternatives will be aligned to the corresponding intersecting point (vertical blue line to the objective lines). We also added optional legend lines to see the connection from the alternative to the intersecting point.

Edit Model Name
The Project Manager can now edit the model name by double-clicking or right-clicking the model name at the top.

Radar Sensitivity Enhancements
The Radar Sensitivity objectives bars are now draggable so we can see how the change in objective priority can affect the alternative priorities, the bar colors are also updated based on the color settings.

Open Model Lookup to another window
We added a toggle to open a separate non-modal page in a new window. This is helpful so that you can easily use the page look-up to navigate to different pages without having to close the pop-out window.

"Forgot password" option on the Signup/Login page
Added the Forgot Password option on the signing-up/logging-in page:

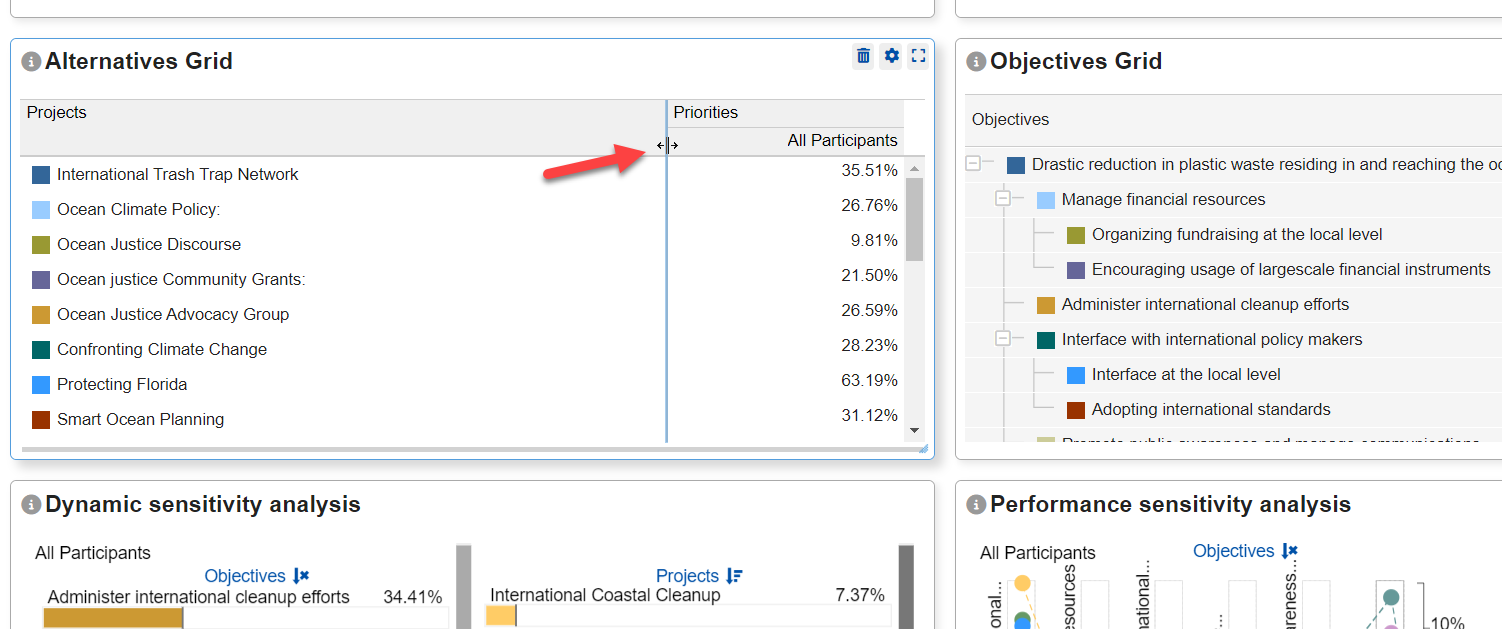
Re-arrange columns on the Alternatives/Objectives Grid
The participants and groups columns can now be re-arranged by drag/drop.

Show Model Name and Description in CS Meeting
We added a heading on the Collaborative Structuring meeting to show the Model Name.

We also added a Model Description pop-out when starting the Collaborative Brainstorming meeting. The pop-out will automatically show up unless disabled by the Project Manager. It can also be opened from the i icon.

Model Details Summary
The model details summary is viewable from the Models list and Model Details page"

Tooltips to spell out labels on RA Columns
We added tooltips to spell out the labels for Expected Benefits, Probability of Success, and Probability of Failure.

